
The Stability of a Floating Body - Fluid Mechanics Lab report
Abstract
The study of the meta-centric location and the
stability of a floating body is very important in many applications such as
designing of ships. The aim of this experiment is to study the forces acting on
a floating body like the buoyant and gravity force which affect the stability
of the body.
The experiment was done by locating the meta-centric heights and center of gravity position. The experiment was performed for different heights of the adjustable weight, and for different displacements of balancing weight, each time the height of the adjustable weight and the displacement of the jockey weight and the angle of tilt which changes due to changing the position of the balancing weight was recorded. In the end of this experiment, we predict to have an experimental value to be near to the theoretical value due to the specific procedures we worked on.
 |
| Floating balloon |
Objectives
- Ø Understand
how the buoyant force acts on a floating body.
- Ø Understand
the effect of the position of the center of gravity on
floating bodies.
- Ø Calculate
the height of G above the base (dx/dθ) for different
heights of adjustable weight.
- Ø Find the
gradient stability line (Ῡ) for each run.
- Ø Calculate
CG, GM and CM.
- Ø Sketch charts between the angle of tilt and jockey weight position.
Data and calculations
Y1= 30.5cm
Ῡ= 9.3cm
Table-1: collected data
| Position of jockey weight X1 (cm) | |||||||||||
|---|---|---|---|---|---|---|---|---|---|---|---|
| y1 (cm) |
-7.5 |
-6 |
-4.5 |
-3 |
-1.5 |
0 |
1.5 |
3 |
4.5 |
6 |
7.5 |
| 30.5 |
- |
- |
-7.5 |
-5.2 |
-2.8 |
0 |
2.0 |
3.9 |
6.2 |
8.3 |
- |
| 27.5 |
- |
-8.0 |
-6.0 |
-4.2 |
-2.5 |
-0.5 |
1.4 |
3.4 |
5.2 |
7.0 |
- |
| 24.5 |
-8.5 |
-7.0 |
-5.0 |
-3.5 |
-2.0 |
-0.5 |
1.1 |
3.0 |
4.5 |
6.0 |
8.0 |
| 18.0 |
-6.0 |
-5.0 |
-4.0 |
-2.5 |
-1.5 |
-0.4 |
0.8 |
2.0 |
3.5 |
4.5 |
5.8 |
| 14.5 |
-5.5 |
-4.5 |
-3.5 |
-2.5 |
-1.5 |
-0.3 |
0.6 |
1.9 |
3.0 |
3.9 |
5.0 |
| Angle of tile (degrees) | |||||||||||
Calculations
1. To calculate the constant A
We calculate it using the initial condition at Ῡ= 9.3cm and y1= 30.5cm , from the following equation:

Where
Ῡ: The height of G above base.
y: The height of adjustable weight above base.
A: Is a constant to be determined from the first measurement.

1) 2. To calculate the distance CM using the experimental data

ὼ: Jockey weight [0.2 kg]
W: Total weight of assembly [2.6 kg]
dx/dθ: Gradient stability line [mm/degree]
V: Total displacement volume = W/Ꝭ = 2.6/1000 = 0.0026 [m3]
L: Length of pontoon [0.36 m]
D: Breadth of pontoon [0.206 m]


I: Second moment of area
Balancing weight = 0.5 kg
Sample calculation:
Calculating CMexp for trail No.4

Results
Table-2: Calculations of CM
| y1 (cm) |
ỹ (cm) |
A (cm) |
dx/d𝛳 (mm/degree) |
GM (cm) |
CG (cm) |
Experimental CM (cm) |
|---|---|---|---|---|---|---|
| 30.5 |
9.30 |
3.4 |
0.6642 |
0.0511 |
9.295 |
9.346 |
| 27.5 |
8.69 |
3.4 |
0.7990 |
0.0615 |
8.685 |
8.747 |
| 24.5 |
8.11 |
3.4 |
0.9213 |
0.0709 |
8.105 |
8.176 |
| 18.0 |
6.86 |
3.4 |
1.2615 |
0.0970 |
6.855 |
6.952 |
| 14.5 |
6.19 |
3.4 |
1.4162 |
0.1089 |
6.185 |
6.294 |
 |
Graph
No.1: The relation between the angles of the tilt vs. the jockey weight
position when y1 = 30.5 cm. |
 |
Graph
No.2: The relation between the angles of the tilt vs. the jockey weight
position when y1 = 27.5 cm. |
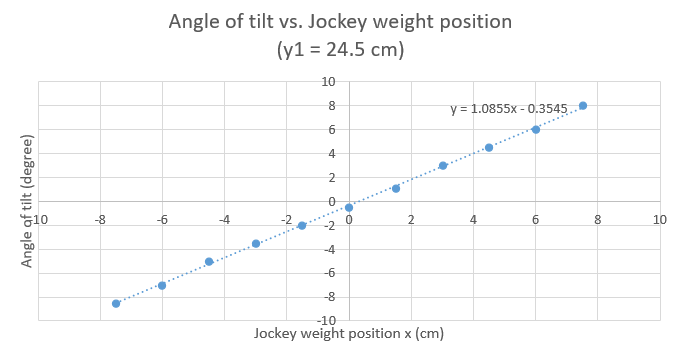 |
Graph
No.3: The relation between the angles of the tilt vs. the jockey weight
position when y1 = 24.5 cm. |
 |
Graph
No.4: The relation between the angles of the tilt vs. the jockey weight
position when y1 = 18.0 cm. |
 |
Graph
No.5: The relation between the angles of the tilt vs. the jockey weight
position when y1 = 14.5 cm. |
 |
| Graph No.6: Shows the relation between the dx/dθ vs. CG |
Discussion of results
It is
clear from graphs No.(1-5) that there is a linear relationship between the
angle of tilt and the position of the jockey weight, the graphs No.(1-5) also
show a value of
The
values of the change in position of jockey weight with respect to tilt angle
(dx/dθ) were found for each graph No.(1-5) and were drawn versus the position
of the center of gravity (CG) in graph No.6. It is noticed that there is an
inverse relationship between (dx/dθ) and CG and as the ratio (dx/dθ) decreases
the stability of the floating body will decrease.
Conclusion
In this
experiment the pontoon was floated in water for different positions of the
adjustable weight, the jockey weight was moved from its central position to
both sides in increments of 1.5 cm each time and the angle of tilt was measured
for each step.
The
relationship between the angle of tilt
The
results of this experiment can be improved by improving the devices used and
the conditions of the environment that the experiment was performed in, like
using different shapes of the pontoon, or using more accurate one with perfect
weight distribution, and using more accurate tilt needle. Some of the
environmental conditions which could affect the results are vibrations and the
slope in the lab floor. Another source of errors are blunder errors, like not
placing the jockey weight in the right position or taking wrong reading of the
height of the balancing weight, and taking the reading of the angle while not
looking perpendicularly at the angle meter.


No comments: