
The superheterodyne receiver lab report
INTRODUCTION
The reception of broadcast signal is a part of telecommunication system with which the general public is most familiar through radio and television.
The basic principle of reception apply equally to both radio and television. This experiment demonstrate these principles by means of the radio receiver.
OBJECTIVE
1- To receive radio signal and make necessary operation to adjust it and get the best receiving to the channel2- To know the components of super heterodyne receiver and the basic job to these component .
THE APPARATUS
The apparatus comprises a radio receiver with a retractable aerial. Each stage in a typical transistorized radio receiver is represented. Signals in the medium wave band can be selected, amplified, detected, and passed to a loudspeaker or modulation.Facilities are provided for inspecting signals between stages, and for adjusting the interstage coupling to allow the receiver to be lined up for best reception.
The following equipment are required:
1- an r.f signal generator.
2- A calibrated attenuator.
 |
| BLOCK DIAGRAM OF A TYPICAL SUPERHETERODYNE RECEIVER |
The Superheterodyne Receiver
The signal from aerial is amplified and passed through a band-limiting selective stage to a mixer stage. In the mixer a signal from a local oscillator which is a part of the receiver, is mixed with the signal from the aerial, to produce a signal at the difference frequency ( f0 – fs ) called the intermediate frequency as shown in figure 8.2.the local oscillator tuning is connected to the aerial selectivity circuits, so that for a complete band of signal freq’s. for which the receiver is designed this difference freq. Remains substantially constant. the local oscillator is said to track the signal.The intermediate stage can be designed for optimum gain. And rejection of unwanted signals, the more able the receiver is to reject unwanted signals the more the selective the receiver is said to be. Once the unwanted signals has been adequately raised in power from the very low signals received by the aerial. The amplitude modulation is detected.
RECEIVER ALIGNMENT
It is necessary to adequately align the receiver proceeding to other experiments. The alignment of the receiver is the adjustment of the inter-stage transformer to obtain an optimum response to the wanted signal. A signal of 465KHz should be applied to the input of the last i.f. amplifier through a small capacitor. This should be 30% amplitude modulated by an A.F. sinusoid. The a.g.c should be switched out and the input to the previous stage connected to the green earth terminal.With the audio volume is maximum, adjust the level of the signal to give a medium range reading on the output Adjust the coupling between the last i.f. stage and the detector stage for maximum output, reducing the signal input to keep the reading on the scale. Repeat the process with a signal generator applied to the penultimate stage, so that the coupling between the final two stages can be optimized for maximum output. For the first i.f. stage apply the generator through a small capacitor to the frequency changer input with no local oscillator input.The signal generator output level may need to be increased considerably to overcome the damping of the preceding tuned circuit which is resonant at the radio freq. And not at i.f. to optimize the coupling between oscillator and frequency changer, firstly tune the signal generator and receiver to a freq. Near the low freq.
( say 600KHz ) end of the range and connect the signal generator output to the receiver input, the oscillator inductor is then adjusted for maximum output.Tune the receiver and signal generator to a freq. Near to the high freq. End of the range. Adjust the i.f. tuner for maximum receiver output. Repeat this cycle until further adjustment is found to be necessary at either end of the range.
SENSITIVITY
Sensitivity is defined as the minimum value of input carrier, which modulated 30% at A.F. gives 50mW output with a signal-to-noise ratio 15dB. It is usually of the order of a few μV. And varies over the reception band of the receiver. A standard dummy aerial must be used with signal generator to simulate an open aerial. The procedure is to connect the signal generator via the dummy aerial to the receiver aerial, which should be right down.The signal selectivity controls should be adjusted to maximum output power.The a.g.c. should be disconnected so that the full gain of the amplifier is available all input levels .Initially the audio volume control should be tuned to giv maximum output. The input power from the signal generator is adjusted until the output power is 50mW. The signal generator is switched off so that the noise power at the output can be measured. This should be less than 1.181mW.if this is so, the signal generator output power is the sensitivity of the receiver. If the noise output with no input is greater then 1.585mW the audio volume control must be adjusted to reduce the noise power. To obtain the standard output the signal generator output should be increased to obtain 50mW at the output. The signal generator output power is the sensitivity of the receiver.
The sensitivity should be measured at 4 number of input freq’s. and plotted as a function of input freq’s. plot the signal noise ratio for each sensitivity measurement.
SELECTIVITY
As the signal from the wanted station may be weaker at the receiver input than that from the unwanted station it is essential that the unwanted signal suffers as much loss as possible prior to the detector. The interference can appear as a heterodyne whistle if the freq. Difference between desired and undesired channels is equal to an audio freq.There are a number of ways of measuring selectivity . some of which test the cross-modulation of the receiver. The method described her is really a measure of the tuning freq. Response curve.
The automatic gain control is switched off. An unmodulated carrier at a freq. Of about 465KHz, is applied to the freq. Changer input supplied on the apparatus via a calibrated attenuator. The level at the detector output is noted. The input freq. Is adjusted for a maximum level out. The attenuator is adjusted to zero attenuation and the level of the input is adjusted so that the ratio level out to level out with signal off is at least twenty times. The input level in decreased decibel by decibel with insertion of the attenuation until the detected voltage stats to fall.
Reverse the process by enough insuring that the i.f. strip is working linearly. Vary the freq. Of the input signal freq. On either side of this optimum freq. By 20KHz
For each spot freq. Adjust the attenuator so that the output level remains constant. Plot attenuator versus freq.
An alternative method is to supply a signal modulated 30% by A.F. at the receiver aerial via an attenuator with the output measured on the audio output meter. With a.g.c. off and audio volume control remaining constant and the receiver tuned to the input carrier freq. The level setting procedure is carried out as before.
AUTOMATIC GAIN CONTROL
The a.g.c. performance should be measured about mid-frequency of the signal freq. Range. The measure of the effectiveness of the a.g.c. is compression of the input signal level variation by the receiver. With the a.g.c. in connect a signal generator 30% amplitude modulation by an A.F. sinusoid. Via a dummy aerial, to the receiver aerial. The signal level should be increased in step of sex decibel, or doubled in voltage. Reading the output power of each step until the input signal is about 1 volt. The maximum meter reading is not exceeded the curve of output power against input carrier in decibel is the a.g.c. characteristic of the receiver.Signal to noise ratio should also be plotted for a.g.c. in and for a.g.c. out by switching the carrier modulation off at each step to give the noise level.
MEASURMENT OF THE IMAGE CHANNEL REJECTION RATIO
A signal at twice the i.f. away from the wanted r.f signal can mix with the oscillator freq. To produce a detectable signal. This is called the image signal. The image channel rejection ratio of a receiver is specified as the ratio of the wanted signal to the unwanted image channel transmission. The signal freq. Amplifiers are usually responsible for most of the rejection. First the sensitivity of the receiver is measured as befor, the signal generator carrier freq. Is then increased by a freq. Equal to twice the i.f. without altering the controls the sensitivity is measured again.The ratio of this two sensitivities in decibels is the image channel rejection ratio. The measurment should be performed at two or three freq’s. over the signal freq. Range and the image channel rejection ratio plotted against input carrier frequency.

Block Diagram Of A Typical Super heterodyne Receiver
Results and Conclusions
Experiment:
Block Diagram Of A Typical Super heterodyne Receiver
Fs: receive the message signal
Fo: change to get a fixed fi signal
Fi :fixed frequency result from the difference between fo and fs
Detector : remove carrier wave(fi)
a.f.:make the necessary amplification to the signal to be combatable with speaker and be clear as possible
Measurement
Fo frequency =1.132MHz
AM(p-p)= 60 mV
Fi frequency =201KHz
IF frequency =432 KHz
AF frequency = 314 Hz
Carrier frequency = 1.134-0.433=0.699 KHz
 |
| R.F Signal |
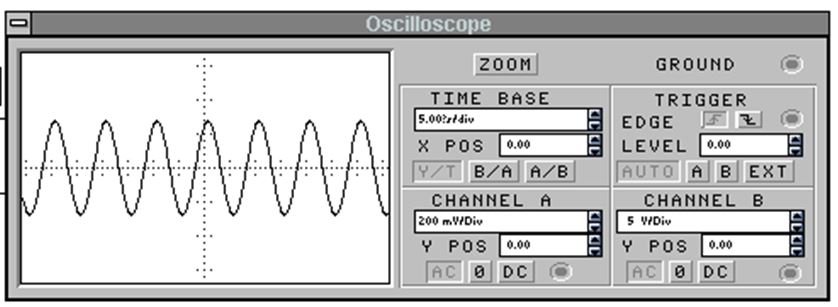 |
| Signal after amplification |
Receiver alignment
In order for the system to work properly it must be aligned this process is done by adjusting the inter stage transformers to obtain optimum response to the wanted signal, 465KHz should be applied to the input of the last I.F amplifier through a small capacitor.
Sensitivity
Is defined as the minimum value of input carrier which is modulated 30% at A.F gives 30mw output with a signal to noise of 15db.
Selectivity
Is a measure of the ability of the receiver to discriminate against undesired signals. Interference arises from the adjacent channel signals I.E. those from stations transmit at frequencies close to 9kHz away from the wanted signal frequency. This interference can appear as a hetrodyne whistle.


The sole purpose of a slot machine is to redistribute wealth from the poor and stupid to the rich. Nikki is such a slot machine, on Friday she enjoyed herself some fish but on Saturday she wished a facet of meat. I performed several of} hundred dollars at one on line casino in one evening at a hundred dollars every and misplaced each time, mixing up my bets. I performed eight thousand dollars in five hours between three casinos on the Las Vegas strip and misplaced all of it. These places have an operations room that enables them to manage the winnings and the losings, from the video games 카지노 사이트 to the rewards cards they persuade you enroll for|to join|to enroll in}, all for them to control you even further.
ReplyDelete